

Databricks recently introduced Free Edition, which opened the door for us to create a free hands-on course on MLOps with Databricks.
This article is part of that course series, where we walk through the tools, patterns, and best practices for building and deploying machine learning workflows on Databricks.
Watch the lecture on YouTube.

In the previous lecture, we covered the theory behind ML model monitoring and the tools Databricks provides for it. In this session, we’ll walk through a practical example, from inference tables to Lakehouse Monitoring implementation.
Our monitoring system consists of four key components:
Inference Logging: Capturing model inputs and outputs
Monitoring Table Creation: Transforming raw logs into a format suitable for monitoring
Scheduled Refreshes: Keeping monitoring data up-to-date
Monitoring Dashboard: Visualizing metrics and detecting drift
Let’s examine each component in detail.
1. Inference Data Collection
!Make sure that inference tables is enabled for your serving endpoint.
First, we need to collect data from our model serving endpoint. The notebook lecture10.marvel_create_monitoring_table.py demonstrates how to send requests to our endpoint and then process the logged data. In lecture 6, we learned how to call the model endpoint. There are two ways to do this: either via HTTPS or by using the Workspace Client.
def send_request_https(dataframe_record):
    """
    Sends a request to the model serving endpoint using HTTPS.
    """
    serving_endpoint = f"https://{os.environ['DBR_HOST']}/serving-endpoints/marvel-characters-model-serving/invocations"

    response = requests.post(
        serving_endpoint,
        headers={"Authorization": f"Bearer {os.environ['DBR_TOKEN']}"},
        json={"dataframe_records": dataframe_record},
    )
    return response.status_code, response.text

def send_request_workspace(dataframe_record):
    """
    Sends a request to the model serving endpoint using workspace client.
    """
    response = workspace.serving_endpoints.query(
        name="marvel-characters-model-serving",
        dataframe_records=dataframe_record
    )
    return response
We sample records from our test set and send them to the endpoint to generate some logs.
test_set = spark.table(f"{config.catalog_name}.{config.schema_name}.test_set") \
                    .withColumn("Id", col("Id").cast("string")) \
                    .toPandas()

# Sample records for testing
sampled_records = test_set[required_columns].sample(n=100, replace=True).to_dict(orient="records")
dataframe_records = [[record] for record in sampled_records]

# Test the endpoint
for i in range(len(dataframe_records)):
    status_code, response_text = send_request_https(dataframe_records[i])
    print(f"Response Status: {status_code}")
    print(f"Response Text: {response_text}")
    time.sleep(0.2)
2. Monitoring Implementation
2.1 Creating and Refreshing Monitoring
Once logs start appearing in the inference table, we can move on to processing them into a monitoring table. For this, we’ve created a new module at src/marvel_characters/monitoring.py, which contains the logic for transforming inference logs into a structured monitoring table.
from databricks.connect import DatabricksSession
from databricks.sdk import WorkspaceClient

from marvel_characters.config import ProjectConfig
from marvel_characters.monitoring import create_or_refresh_monitoring

spark = DatabricksSession.builder.getOrCreate()
workspace = WorkspaceClient()

# Load configuration
config = ProjectConfig.from_yaml(config_path="../project_config_marvel.yml", env="dev")

create_or_refresh_monitoring(config=config, spark=spark, workspace=workspace)
This function below processes the inference data from a Delta table,
parses the request and response JSON fields, writes the resulting DataFrame to a Delta table for monitoring purposes.
def create_or_refresh_monitoring(config: ProjectConfig, spark: SparkSession, workspace: WorkspaceClient) -> None:
    """Create or refresh a monitoring table for Marvel character model serving data.

    This function processes the inference data from a Delta table,
    parses the request and response JSON fields, writes the resulting DataFrame to a Delta table for monitoring purposes.

    :param config: Configuration object containing catalog and schema names.
    :param spark: Spark session used for executing SQL queries and transformations.
    :param workspace: Workspace object used for managing quality monitors.
    """
    # Check if custom_model_payload table exists and has data
    inf_table = spark.sql(f"SELECT * FROM {config.catalog_name}.{config.schema_name}.`custom_model_payload`")
    inf_count = inf_table.count()
    logger.info(f"Found {inf_count} records in custom_model_payload table")

    if inf_count == 0:
        logger.warning("No records found in custom_model_payload table. Monitoring table will be empty.")
        return
The function defines schemas for parsing the JSON request and response data:
  request_schema = StructType(
        [
            StructField(
                "dataframe_records",
                ArrayType(
                    StructType(
                        [
                            StructField("Height", DoubleType(), True),
                            StructField("Weight", DoubleType(), True),
                            StructField("Universe", StringType(), True),
                            StructField("Identity", StringType(), True),
                            StructField("Gender", StringType(), True),
                            StructField("Marital_Status", StringType(), True),
                            StructField("Teams", StringType(), True),
                            StructField("Origin", StringType(), True),
                            StructField("Magic", StringType(), True),
                            StructField("Mutant", StringType(), True),
                        ]
                    )
                ),
                True,
            )
        ]
    )

    response_schema = StructType(
        [
            StructField("predictions", ArrayType(IntegerType()), True),
            StructField(
                "databricks_output",
                StructType(
                    [StructField("trace", StringType(), True), StructField("databricks_request_id", StringType(), True)]
                ),
                True,
            ),
        ]
    )
It then parses the JSON data and transforms it into a structured format:
 inf_table_parsed = inf_table.withColumn("parsed_request", F.from_json(F.col("request"), request_schema))
    inf_table_parsed = inf_table_parsed.withColumn("parsed_response", F.from_json(F.col("response"), response_schema))
    df_exploded = inf_table_parsed.withColumn("record", F.explode(F.col("parsed_request.dataframe_records")))

    df_final = df_exploded.withColumn("timestamp_ms", (F.col("request_time").cast("long") * 1000)).select(
        F.col("request_time").alias("timestamp"),  # Use request_time as the timestamp
        F.col("timestamp_ms"),  # Select the newly created timestamp_ms column
        "databricks_request_id",
        "execution_duration_ms",
        F.col("record.Height").alias("Height"),
        F.col("record.Weight").alias("Weight"),
        F.col("record.Universe").alias("Universe"),
        F.col("record.Identity").alias("Identity"),
        F.col("record.Gender").alias("Gender"),
        F.col("record.Marital_Status").alias("Marital_Status"),
        F.col("record.Teams").alias("Teams"),
        F.col("record.Origin").alias("Origin"),
        F.col("record.Magic").alias("Magic"),
        F.col("record.Mutant").alias("Mutant"),
        F.col("parsed_response.predictions")[0].alias("prediction"),
        F.lit("marvel-characters-model-fe").alias("model_name"),
    )
The function handles data quality issues and writes the processed data to a monitoring table:
  # Make dropna optional if we're losing all data
    df_with_valid_values = df_final_with_status.dropna(subset=["prediction"])
    valid_count = df_with_valid_values.count()
    logger.info(f"Records with valid prediction values: {valid_count}")

    # If we lost all data after dropna, use the data before dropna
    if valid_count > 0:
        df_final_with_status = df_with_valid_values
        logger.info("Using records with valid prediction values")
    else:
        logger.warning("All records have null prediction values. Using records with potential nulls.")

    # Ensure Height and Weight are properly cast to double
    df_final_with_status = df_final_with_status.withColumn("Height", F.col("Height").cast("double"))
    df_final_with_status = df_final_with_status.withColumn("Weight", F.col("Weight").cast("double"))

    # Write to the monitoring table
    df_final_with_status.write.format("delta").mode("append").saveAsTable(
        f"{config.catalog_name}.{config.schema_name}.model_monitoring"
    )
Finally, it either refreshes an existing monitoring configuration or creates a new one:
    try:
        workspace.quality_monitors.get(f"{config.catalog_name}.{config.schema_name}.model_monitoring")
        workspace.quality_monitors.run_refresh(
            table_name=f"{config.catalog_name}.{config.schema_name}.model_monitoring"
        )
        logger.info("Lakehouse monitoring table exist, refreshing.")
    except NotFound:
        create_monitoring_table(config=config, spark=spark, workspace=workspace)
        logger.info("Lakehouse monitoring table is created.")
2.2 Creating the Monitoring Table
The create_monitoring_table function sets up a new monitoring table with Databricks’ quality monitoring features:
def create_monitoring_table(config: ProjectConfig, spark: SparkSession, workspace: WorkspaceClient) -> None:
    """Create a new monitoring table for Marvel character model monitoring.

    This function sets up a monitoring table using the provided configuration,
    SparkSession, and workspace. It also enables Change Data Feed for the table.

    :param config: Configuration object containing catalog and schema names
    :param spark: SparkSession object for executing SQL commands
    :param workspace: Workspace object for creating quality monitors
    """
    logger.info("Creating new monitoring table..")

    monitoring_table = f"{config.catalog_name}.{config.schema_name}.model_monitoring"

    workspace.quality_monitors.create(
        table_name=monitoring_table,
        assets_dir=f"/Workspace/Shared/lakehouse_monitoring/{monitoring_table}",
        output_schema_name=f"{config.catalog_name}.{config.schema_name}",
        inference_log=MonitorInferenceLog(
            problem_type=MonitorInferenceLogProblemType.PROBLEM_TYPE_CLASSIFICATION,
            prediction_col="prediction",
            timestamp_col="timestamp",
            granularities=["30 minutes"],
            model_id_col="model_name",
        ),
    )

    # Important to update monitoring
    spark.sql(f"ALTER TABLE {monitoring_table} SET TBLPROPERTIES (delta.enableChangeDataFeed = true);")

    logger.info("Lakehouse monitoring table is created.")
Once lakehouse monitoring is created, you will see 2 tables automatically created under the provided catalog and schema as well as a dashboard under dashboards tab.
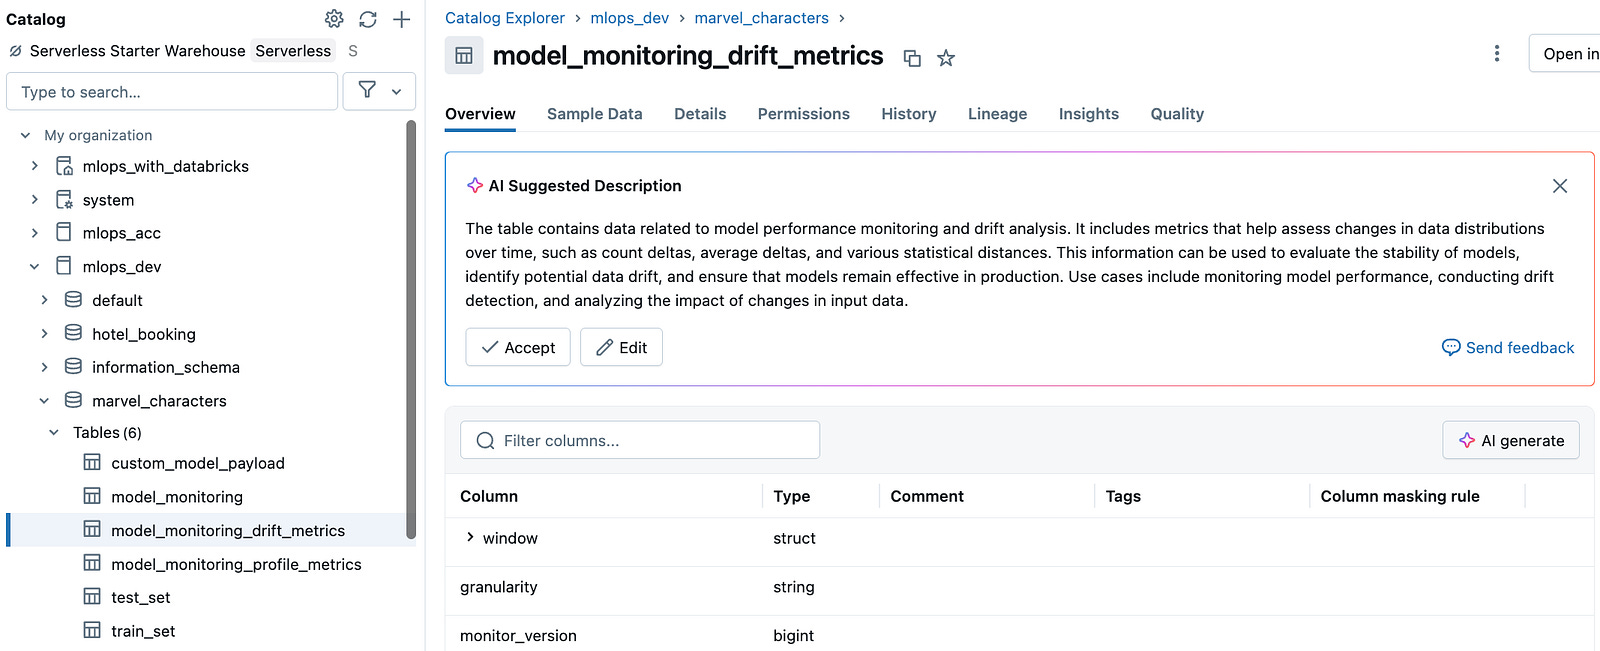
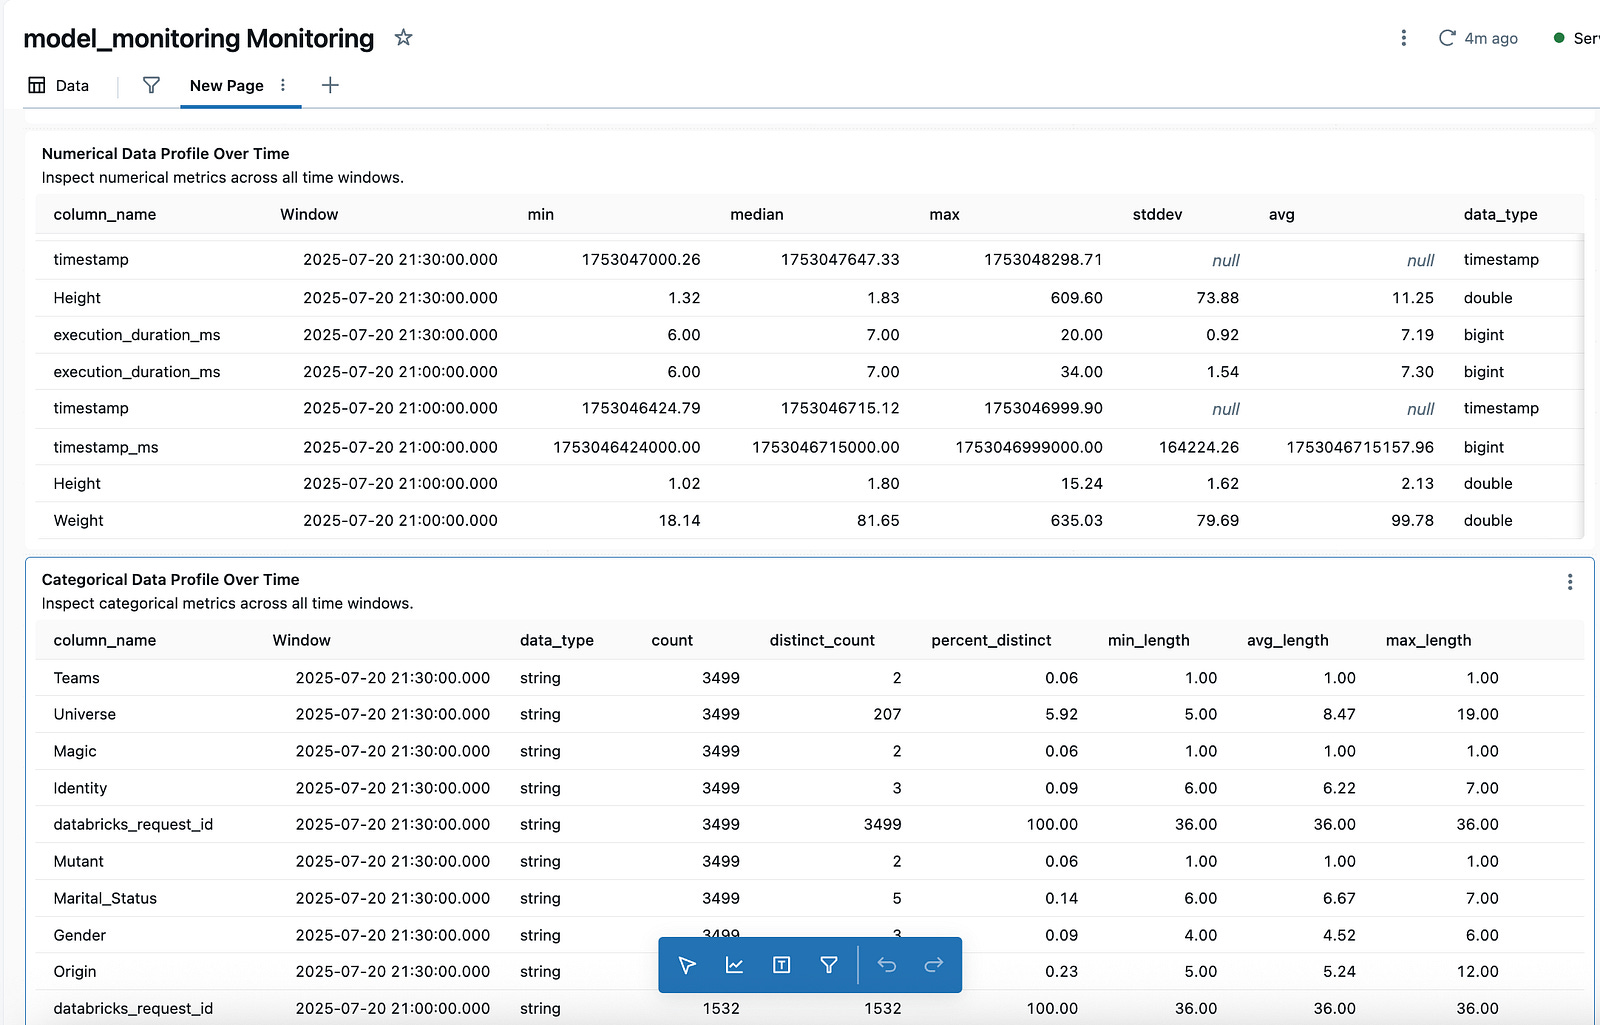
This dashboard has some default panels, but you can create any panel with SQL queries.
3. Scheduled Monitoring Refresh
To keep our monitoring data current, we schedule regular refreshes using Databricks Asset Bundles. The configuration is defined in resources/bundle_monitoring.yml:
resources:
  jobs:
    marvel-characters-monitor-update:
      name: marvel-characters-monitor-update-workflow
      schedule:
        quartz_cron_expression: "0 0 6 ? * MON"
        timezone_id: "Europe/Amsterdam"
        pause_status: ${var.schedule_pause_status}
      tags:
        project_name: "marvel-characters"

      environments:
        - environment_key: monitor-env
          spec:
            client: "3"
            dependencies:
              - ../dist/*.whl

      tasks:
        - task_key: "refresh_monitor_table"
          environment_key: monitor-env
          spark_python_task:
            python_file: "../scripts/refresh_monitor.py"
            parameters:
              - "--root_path"
              - ${workspace.root_path}
              - "--env"
              - ${bundle.target}
This job:
Runs weekly on Mondays at 6:00 AM Amsterdam time
Executes the scipts/refresh_monitor.py script with appropriate parameters
4. Monitoring Refresh Script
The scripts/refresh_monitor.py script is the entry point for our scheduled monitoring job:
import argparse
from databricks.connect import DatabricksSession
from databricks.sdk import WorkspaceClient

from marvel_characters.config import ProjectConfig
from marvel_characters.monitoring import create_or_refresh_monitoring

parser = argparse.ArgumentParser()
parser.add_argument(
    "--root_path",
    action="store",
    default=None,
    type=str,
    required=True,
)

parser.add_argument(
    "--env",
    action="store",
    default=None,
    type=str,
    required=True,
)

args = parser.parse_args()
root_path = args.root_path
config_path = f"{root_path}/files/project_config_marvel.yml"

# Load configuration
config = ProjectConfig.from_yaml(config_path=config_path, env=args.env)

spark = DatabricksSession.builder.getOrCreate()
workspace = WorkspaceClient()

create_or_refresh_monitoring(config=config, spark=spark, workspace=workspace)
This script:
Parses command-line arguments for the root path and environment
Loads the appropriate configuration
Calls the monitoring refresh function
Conclusion
Effective model monitoring is crucial for maintaining ML system reliability. Our implementation:
Captures inference data from model serving endpoints
Transforms this data into a monitoring-friendly format
Schedules regular updates to keep monitoring current
Uses Databricks’ built-in quality monitoring features
By implementing this monitoring system, we can detect issues early, understand model behavior in production, and make data-driven decisions about when to retrain or update our models.